|
Zabbix 3.0 LTS : Add Monitoring Item
2016/03/12 |
|
The templates are provided by default for well known services, so it's easy possible to monitor them.
For example, Add HTTP service for monitoring target item.
|
|
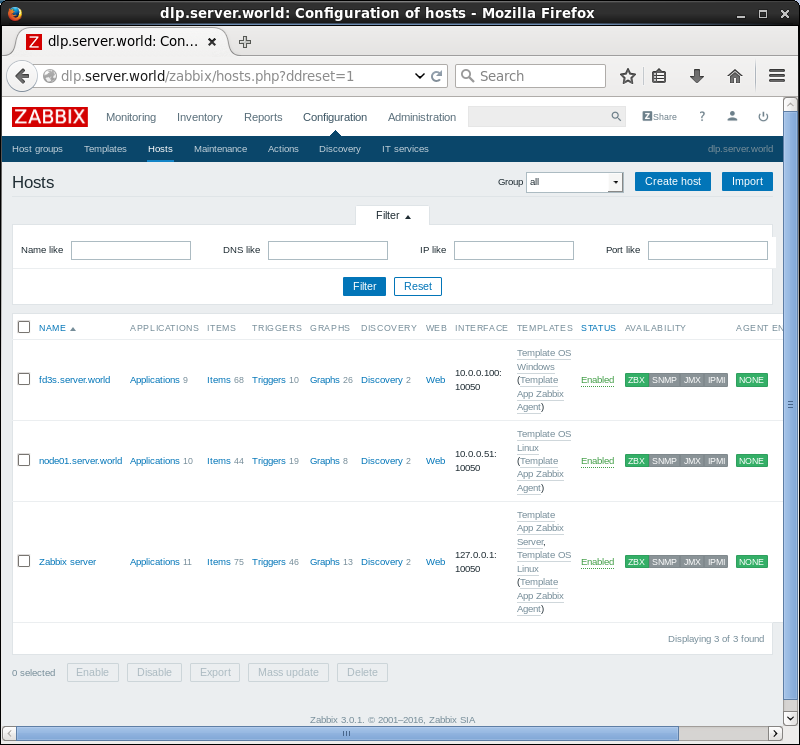
| [1] | Login to Zabbix admin site with admin user and move to [Configuration]-[Hosts] tab and click a hostname you'd like to add an item. |
|
|
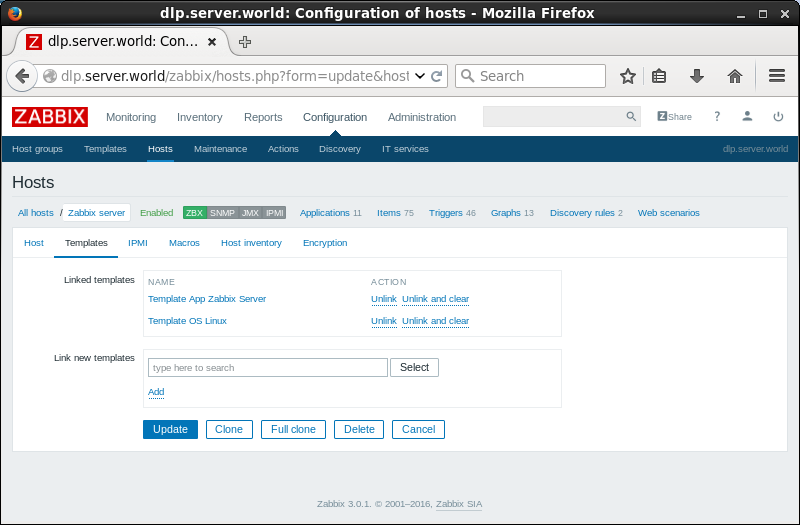
| [2] | Move to [Templates] tab and click 'select'. |
|
|
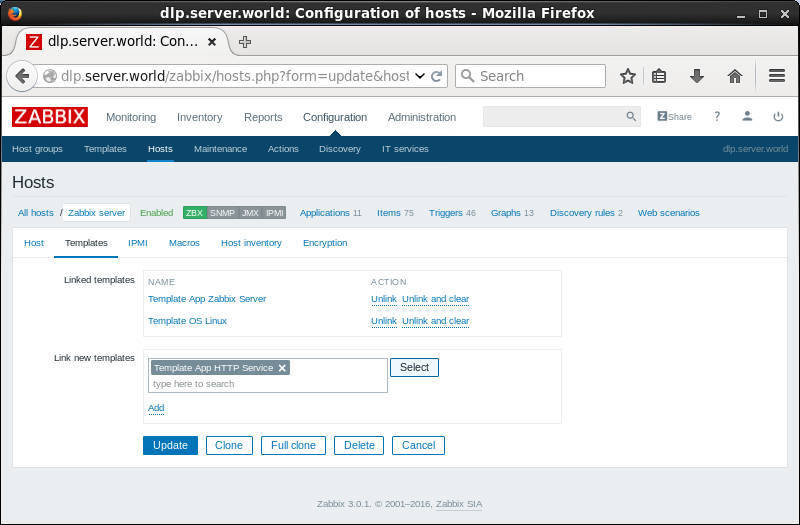
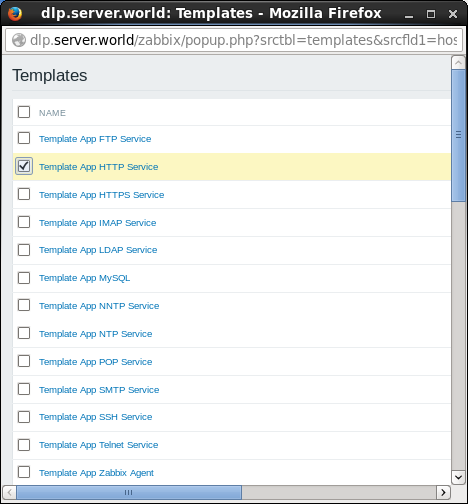
| [3] | Select "Template App HTTP Service". |
|
| [4] | Click "Add" link. |
|
|
| [5] | Click "Update" button. |
|
|
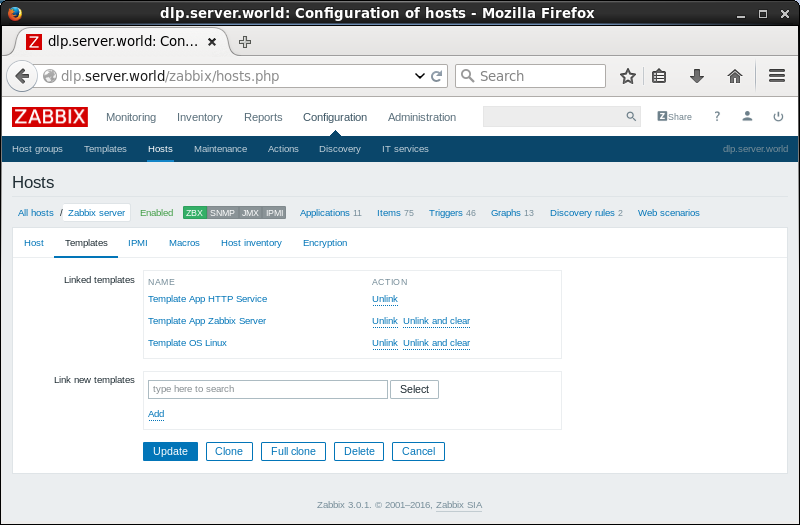
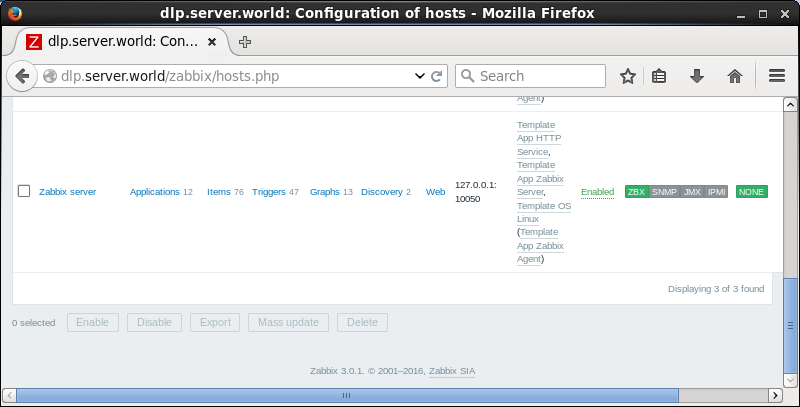
| [6] | The template of HTTP Service is just added. |
|
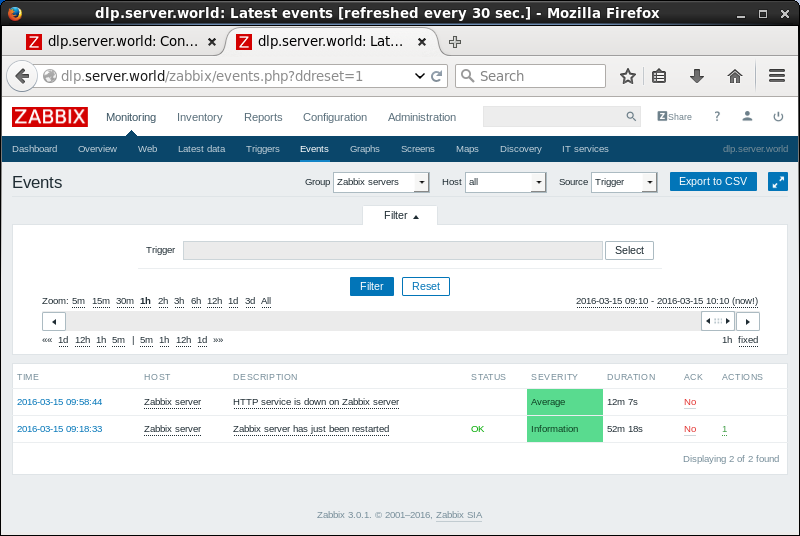
| [7] | The template HTTP Service has an item which it simply checks the status alive or dead. |
|
| [8] | A triger is set by default, so notification is sent like follows if it is down. |
Date: Tue, 15 Mar 2016 20:17:14 +0900 Subject: PROBLEM: HTTP service is down on Zabbix server Content-Type: text/plain; charset="UTF-8" Status: RO Trigger: HTTP service is down on Zabbix server Trigger status: PROBLEM Trigger severity: Average Trigger URL: Item values: 1. HTTP service is running (Zabbix server:net.tcp.service[http]): Down (0) 2. *UNKNOWN* (*UNKNOWN*:*UNKNOWN*): *UNKNOWN* 3. *UNKNOWN* (*UNKNOWN*:*UNKNOWN*): *UNKNOWN* Original event ID: 529 |
